Table of Contents
In this tutorial, we learn to use layouts algorithms and graph properties. We will first import a file system structure, then use the graph properties to find specific files. (*.cpp, *.hpp, ...)
To create a graph representing a directory structure, click menu File → Import → Misc → File System Directory.
Select a directory not too big (to avoid a too long loading time)
Each folder and file is represented as a node, and an edge link each node to its parent folder.
To follow the rest of this tutorial you need to download and open (File → Open) this tulip compressed graph file:
Graph.
This layout algorithm can be found in menu Algorithm → Layout → Tree.
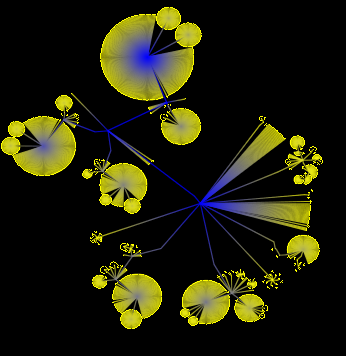
The bubble tree layout is useful to notice directories that have similar structures, as we now demonstrate.
First, have two drawing side by side:
create a second drawing (a Node Link Diagram View) by clicking View → Node Link Diagram View.
Then reorganize the windows by clicking Windows → Tile
Now that we can see both views at the same time, zoom in on the right window:
select the zoom tool  and draw a bounding box on the left side of the graph like this:
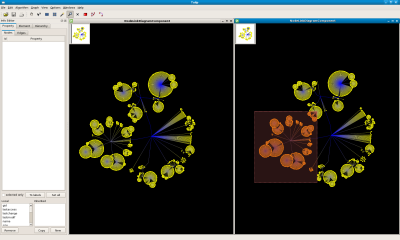
Two nodes looks very alike. With the Get Information tool  ,
we can get their ids: node 1965 and node 2009.
It makes sense that these two directories have the same structure, since they both contain plug-ins source files.
Now, recenter the view (View → Center View or Ctrl+Shift+C).
Let's say that we now want to study our graph without the plug-in directory. To delete the whole directory (in the graph, not on disk), select it, then select all its sub directories, like this:
Select the plug-in directory: use the Find tool (
Edit → Findor Ctrl+F), with parametersInput property:"name", filter: "= plugins".Select all its sub-directories: click
Algorithm → Selection → Reachable Sub-Graphwith distance set to 50.Delete the selected elements: press Del
Re-run the bubble layout:
Algorithm → Layout → Tree → Bubble Tree.
The graph should look like this:
This Layout algorithm can be found in Algorithm → Layout → Tree.
The treemap layout is useful to notice large disk usage files.
First, make sure that Options → Force Ratio is not checked.
Apply the layout algorithm: Algorithm → Layout → Tree → Squarified Tree Map with the following parameters:
Metric: "size".
Aspect Ratio: 1
TreeMap Type?: checked
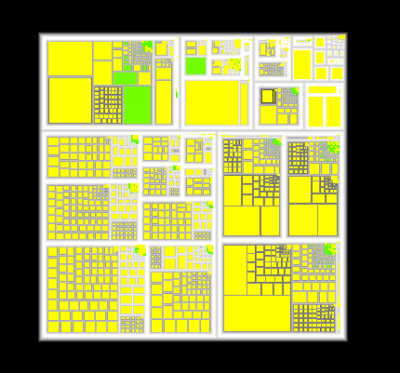
The picture should look like this:
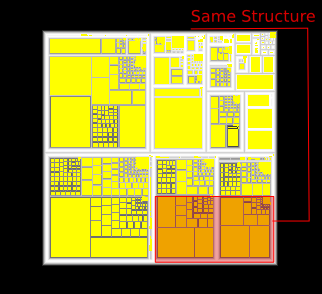
This drawing helps to see filesizes and notice larger files. It represent the hierarchy of directories as nested nodes. See Wikipedia: Tree Maps for more information.
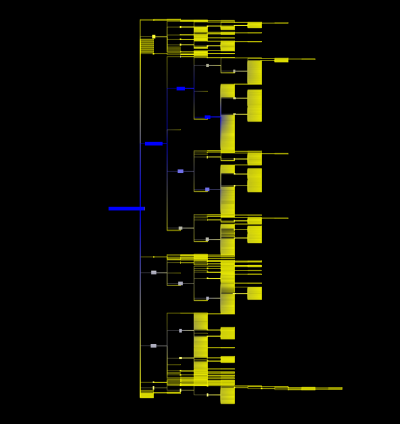
This is a hierarchical layout, useful to understand the tree structure of a file system.
Click Algorithm → Layout → Tree → Improved Walker.
Use the following parameters:
Node Size: viewSize
Orientation: Left to right.
Orthogonal: Checked.
Layer Spacing: Default value.
Node Spacing: Default Value.
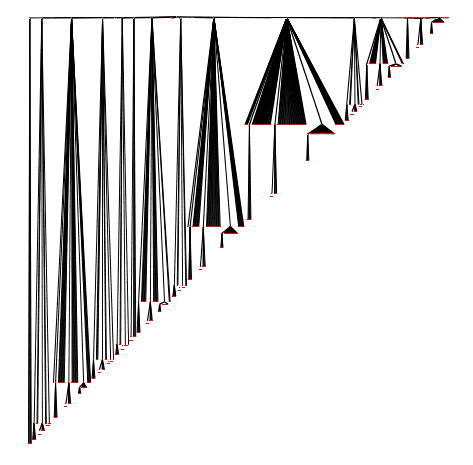
The result should look like this:
Click View Editor → Layer Manager and check the Nodes Label box in the first column.
To view labels, click Graph Editor → Property → name then To labels.
You should now see a graph looking like this:
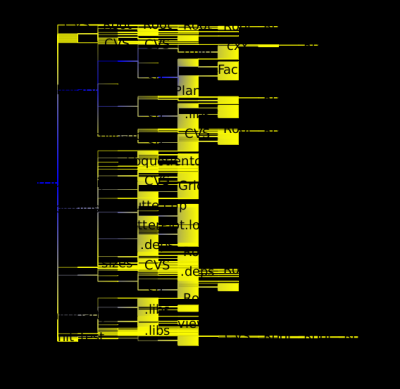
The labels don't fit in nodes, to fix this,
go to the Rendering Parameters tab and check Scale labels to fit node sizes.
The picture should look like this:
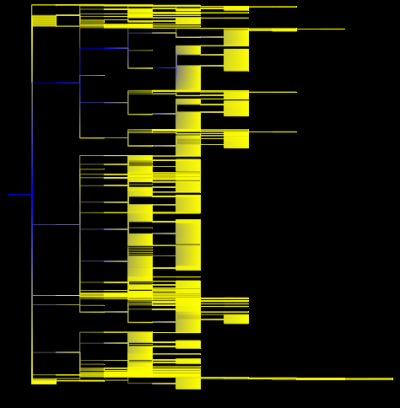
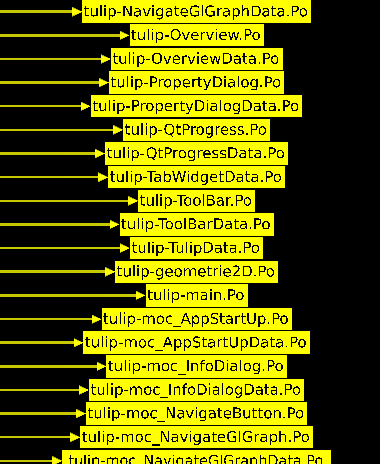
By zooming in we can see the labels:
If you want to display the big file (high disk space) with big nodes, use the Algorithm → Size → Metric Mapping algorithm with parameter "property" set to "size".
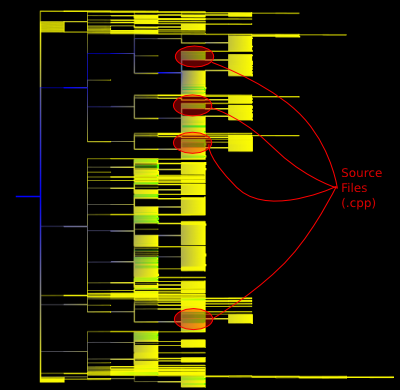
Now that our graph has a nice and clear layout, we would like to locate all our source files (*.cpp). To do so, use Edit → Find (or Ctrl+F) with the following parameters:
Input Property: name
Filter: filter function set to "=" and filter value set to ".*cpp or .*hpp". The filter supports regular expressions: '.' means any character and '*' means any number of times, so '.*' means any character, any number of times. ('*' should not be confused with a wildcard character.) For details on regular expressions, see Wikipedia: Regexp .
Options: check
Replaceand selectOn nodes.
Now that the source files are selected, we apply a different color to them.
Click Graph Editor → Property, select the node property "viewColor", check selected only.
Now that we only see the "viewColor" property of the selected nodes,
click Set all and choose (for instance) green.
The picture should look like this:
