This subwindow is divided in three tabs : Property, Element, Hierarchy.
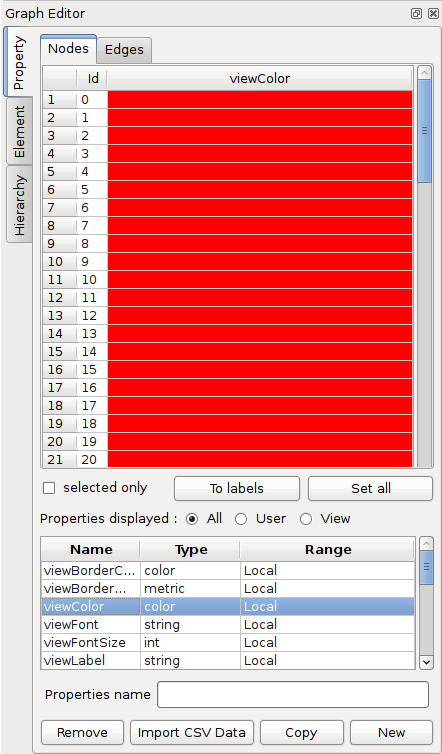
This tab enables to display the properties of nodes and edges as a table. It is composed of two parts. The one of the top of the tab displays all the values of nodes or edges for the selected property (choosen in the lists at the bottom of the tab). It is possible to display only the values of the selected elements by using the selected only box. The user can modify directly a value by double-clicking on the corresponding cell in the table. After editing the value, press the Enter key to update the display of the graph with the new value. It is possible to set all the nodes or edges value with the Set all button; if the selected only box is checked, this will only affect the selected elements. An other possibility is to set as labels the values of the selected property by clicking on the To labels button. The bottom part of the tab displays the lists of all the local and inherited properties of a graph. An inherited property is a property which is defined for an upper graph in the hierarchy of graphs (see the section called “Hierarchy”).

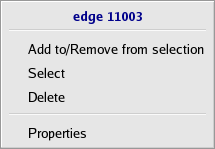
By a right mouse button press (press Ctrl key when mouse pressing on Mac) on a row of the table values, you can display a pop-up menu allowing some actions on the graph element corresponding to the table row:

Add to/Remove from selection: this allows to change the selection state of the element,Select: the current element replaces the whole selection,Delete: this permanently removes the element from the current graph,Properties: this shows the element properties in the “Element” tab (see after).
For more details please visit : Section 3, “Properties of graph”
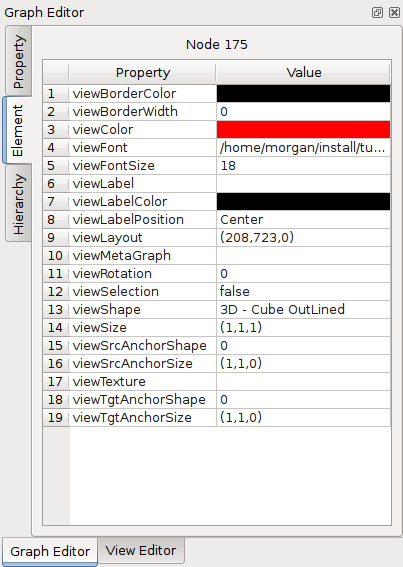
This tab shows informations about an element of the graph, node or edge, previously "pointed" using the  mouse toolbar operation. At the top, you can find the type of the element and its “id”. To follow, here is the table displaying the elements properties and associated values. As within the tables of the “Property” tab, it is possible to update the values within this table.

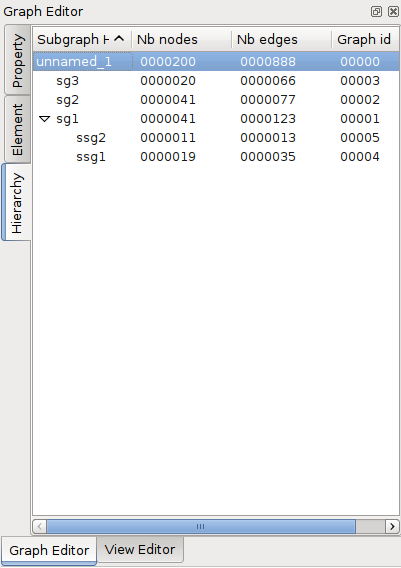
This tab shows the inclusion relationships betweeen the different existing subgraphs and groups of a graph. All of them could be created with the Tulip tools. A hierarchy of graph is often the result of the computation of clustering algorithms.

By a right mouse button press (press Ctrl key when mouse pressing on Mac) in the hierarchy display, you can display a pop-up menu allowing to remove, clone, rename, a graph (subgraph or group).