Submitted by Anonymous on Wed, 2010-03-17 18:15
Posted in
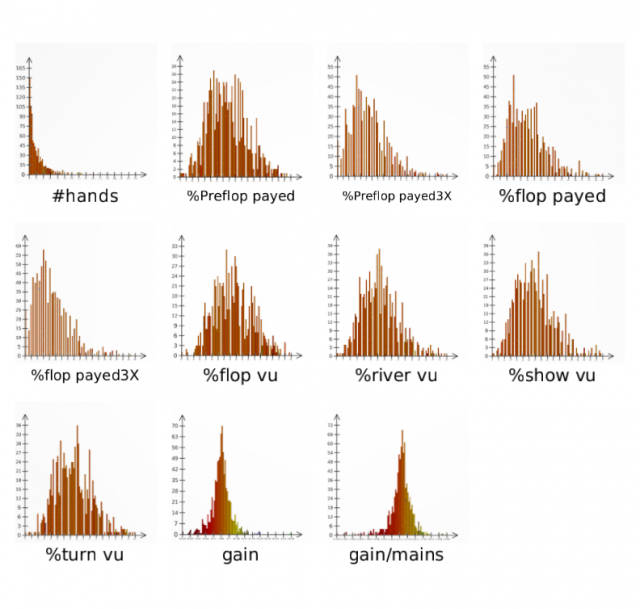
A screenshot of the Tulip Histogram view in small multiples mode. For each selected graph metrics, an overview of its frequency histogram is displayed. User can switch to a more detailed view to perform interactions by double-clicking on an overview.

