First Steps in Tulip
The goal of this part is to follow a small tutorial by creating a graph, saving it, and apply on it the most common analysis operations.
Creation
There are several ways to create a graph: through a generation algorithm, by manually building it element by element, or by importing CSV data (more on it in this page).
Generate a graph
Click on the icon
 Import in the toolbar on the left or in the middle of the workspace if no graph are opened, or select File → Import.
Under the category Graph, select a generation method, for instance Grid Approximation.
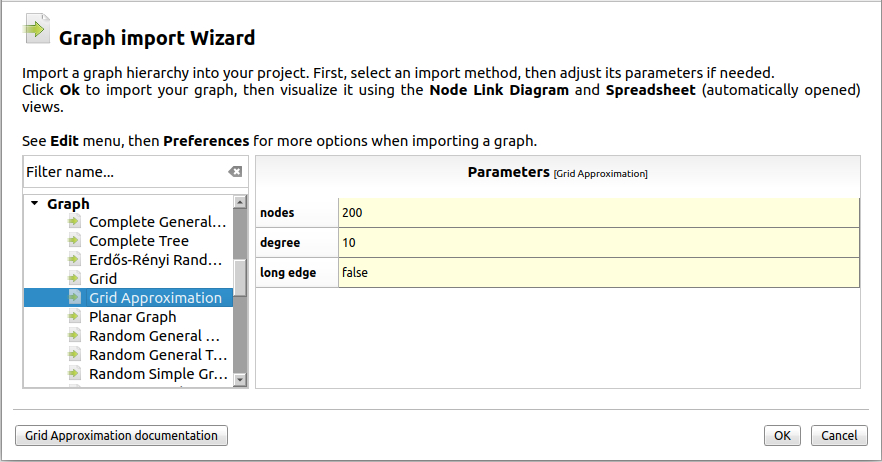
As you can notice, a few properties can be specified, in the Grid Approximation case, the number of nodes, the maximum degree and whether or not long edges should be generated. Those parameters can allow you to generate an example according to your needs. When you have choose your options, click on Finish.
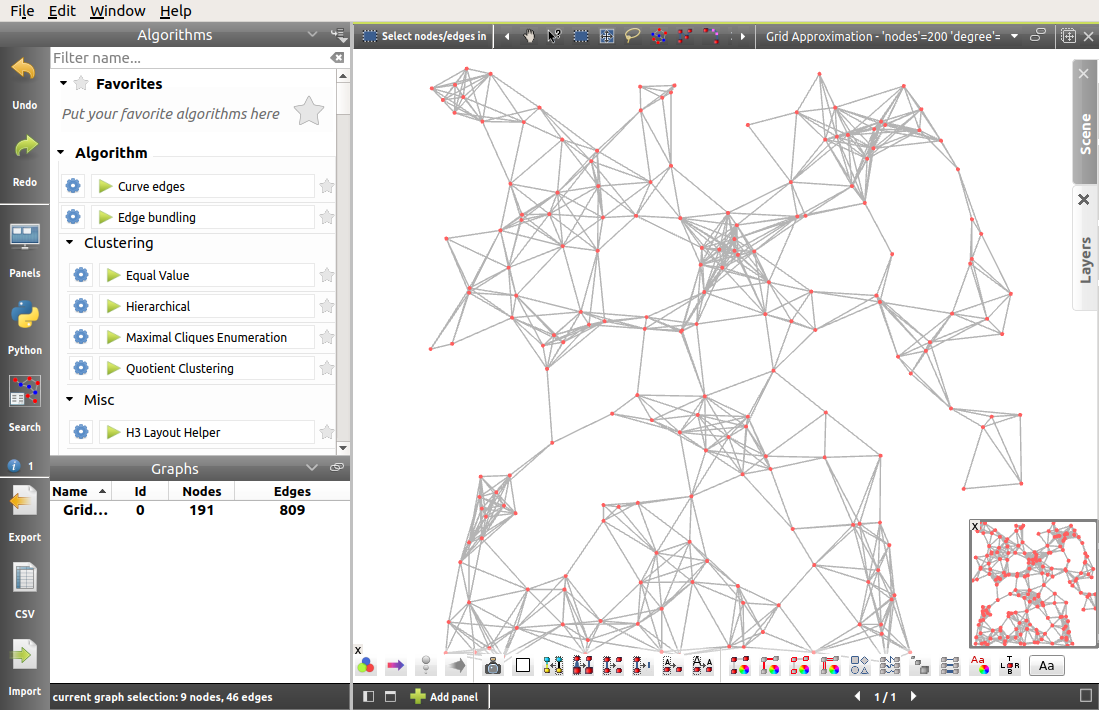
A graph with nodes and edges is now displayed. You can manipulate the camera with a few commands :
You can zoom in and out with the mouse wheel or with Ctrl+Left-Click and a forward or backward movement of the mouse.
Left-click and drag to move the graph.
Shift+Left-Click rotates the graph around the X and Y axis, Ctrl+Left-Click and a translation of the mouse to the left or the right rotates around the Z axis.
To reset the view, just right-click anywhere in the workspace and select Center view (Ctrl+Shift+C).
A few precisions towards Mac users: Tulip is multi-platform, however, significant changes can be spotted from one OS to another. In addition to the different fonts and window systems, the key combinations can also slightly vary. Most of the time in the mouse key combinations, the use of the Ctrl key is replaced by ⌥ (alt) key and in the keyboard shortcuts it is replaced by ⌘ key.
Build a Graph
To create an empty graph, you can invoke the
 Import wizard, by choosing the category Empty Graph, or you can click on File → New graph.
Select the Add nodes/edges tool (
 ). Left click on a few different places in the workspace: each click adds a node. Now, you can add a few links: left click on the source node, then on the target node to create it (middle click aborts the current edge creation).
To delete an element, right click on the element and select the Delete item in the contextual menu then displayed. You can also select the Delete nodes or edges tool (
 ) and click on the element you want to remove.
Save or Export your Work
Tulip allows you to save your whole project (all opened graphs and displayed views) with its own file format (*.tlpx). To do so, select File → Save or File → Save as.
If you are interested to only save one graph, Tulip proposes to save it in its own TLP or TLPB formats (which used the tlp and tlpb file extensions but can also be compressed in indicating the tlpz or tlpbz file extensions); do a right click on the graph’s name in the graph list and select Save in the contextual menu then displayed. You can also export it in the GML format (other plugins can offer more possibilities) by selecting Export in the same contextual menu.
Apply an Algorithm
As a visualization tool, Tulip offers several algorithms to adapt your graph layout. You can use them very simply.
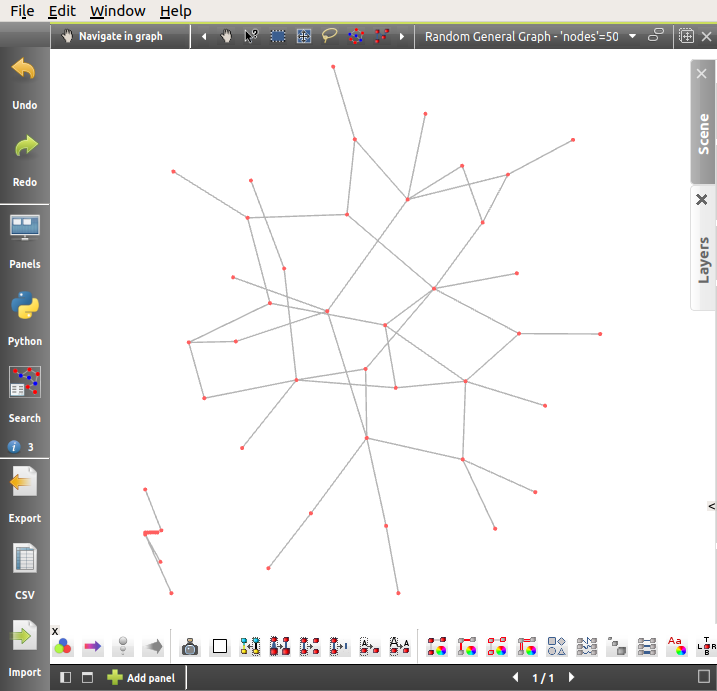
Following the steps mentioned above, let us generate a Random General Graph ([File →] Import → Random General Graph in the Graph category). We will specify here the nodes and edges parameters (Random General Graph specific fields displayed in the import wizard) by typing 50 in both of the fields.
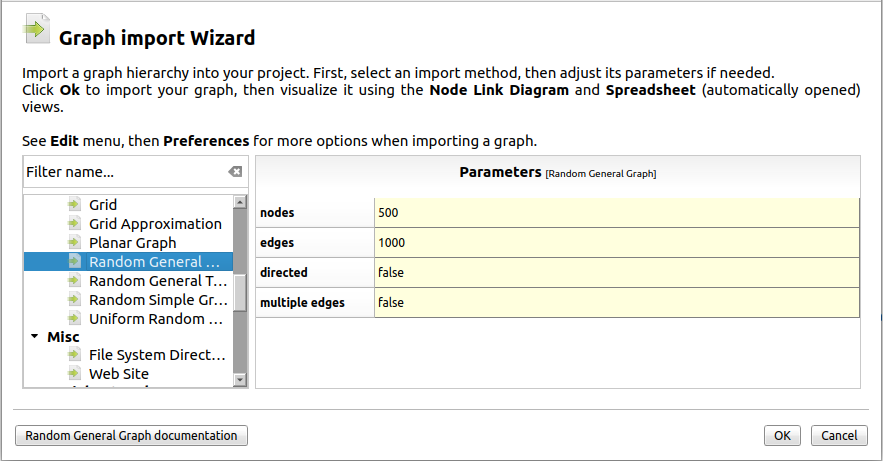
Once the button OK is pressed, you can see a graph similar to this one :
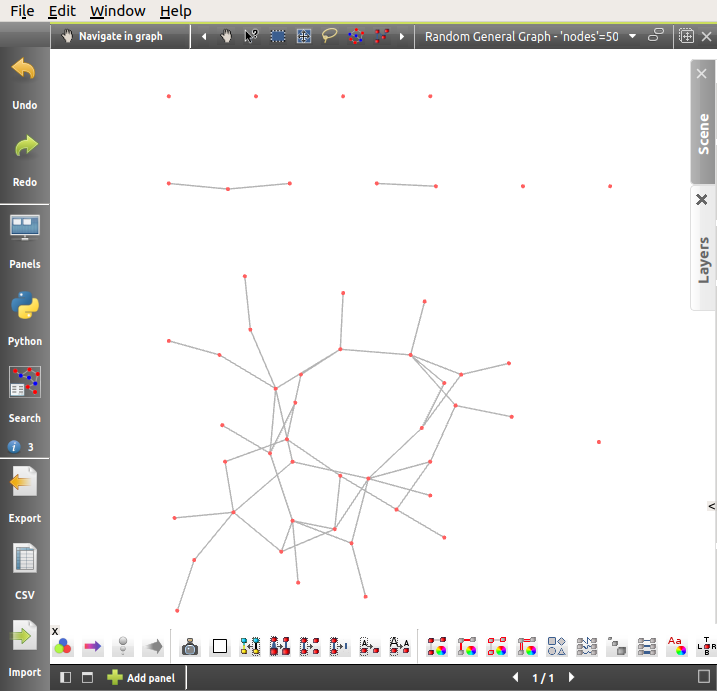
When the generation algorithm does not fix nodes positions, by default, if the generated graph is a tree, the layout algorithm “Tree Radial” is applied; if not the “FM^3 (OGDF)” layout algorithm is applied.
To try to improve it, we can apply another layout algorithm. In the Algorithms window, select Layout → Force directed → GEM (Frick). A new position for each node will be computed in order to get another layout:
Some layout algorithms can only be applied to graphs belonging to a specific graph class. For instance, the Mixed Model algorithm can only be applied to a simple graph. The Tree layout algorithms are dedicated to trees but most of them can be applied to graph of any type (for non-tree graph, the algorithms are applied to a spanning tree of each connected component of the graph); so do not hesitate to experiment in order to find the perfect layout for your data.
There are many algorithms for testing, coloring, resizing… more information on them can be found in the Algorithm section.