A Quick Presentation of the Tulip Perspective
Here are the components of Tulip Perspective’s main window:
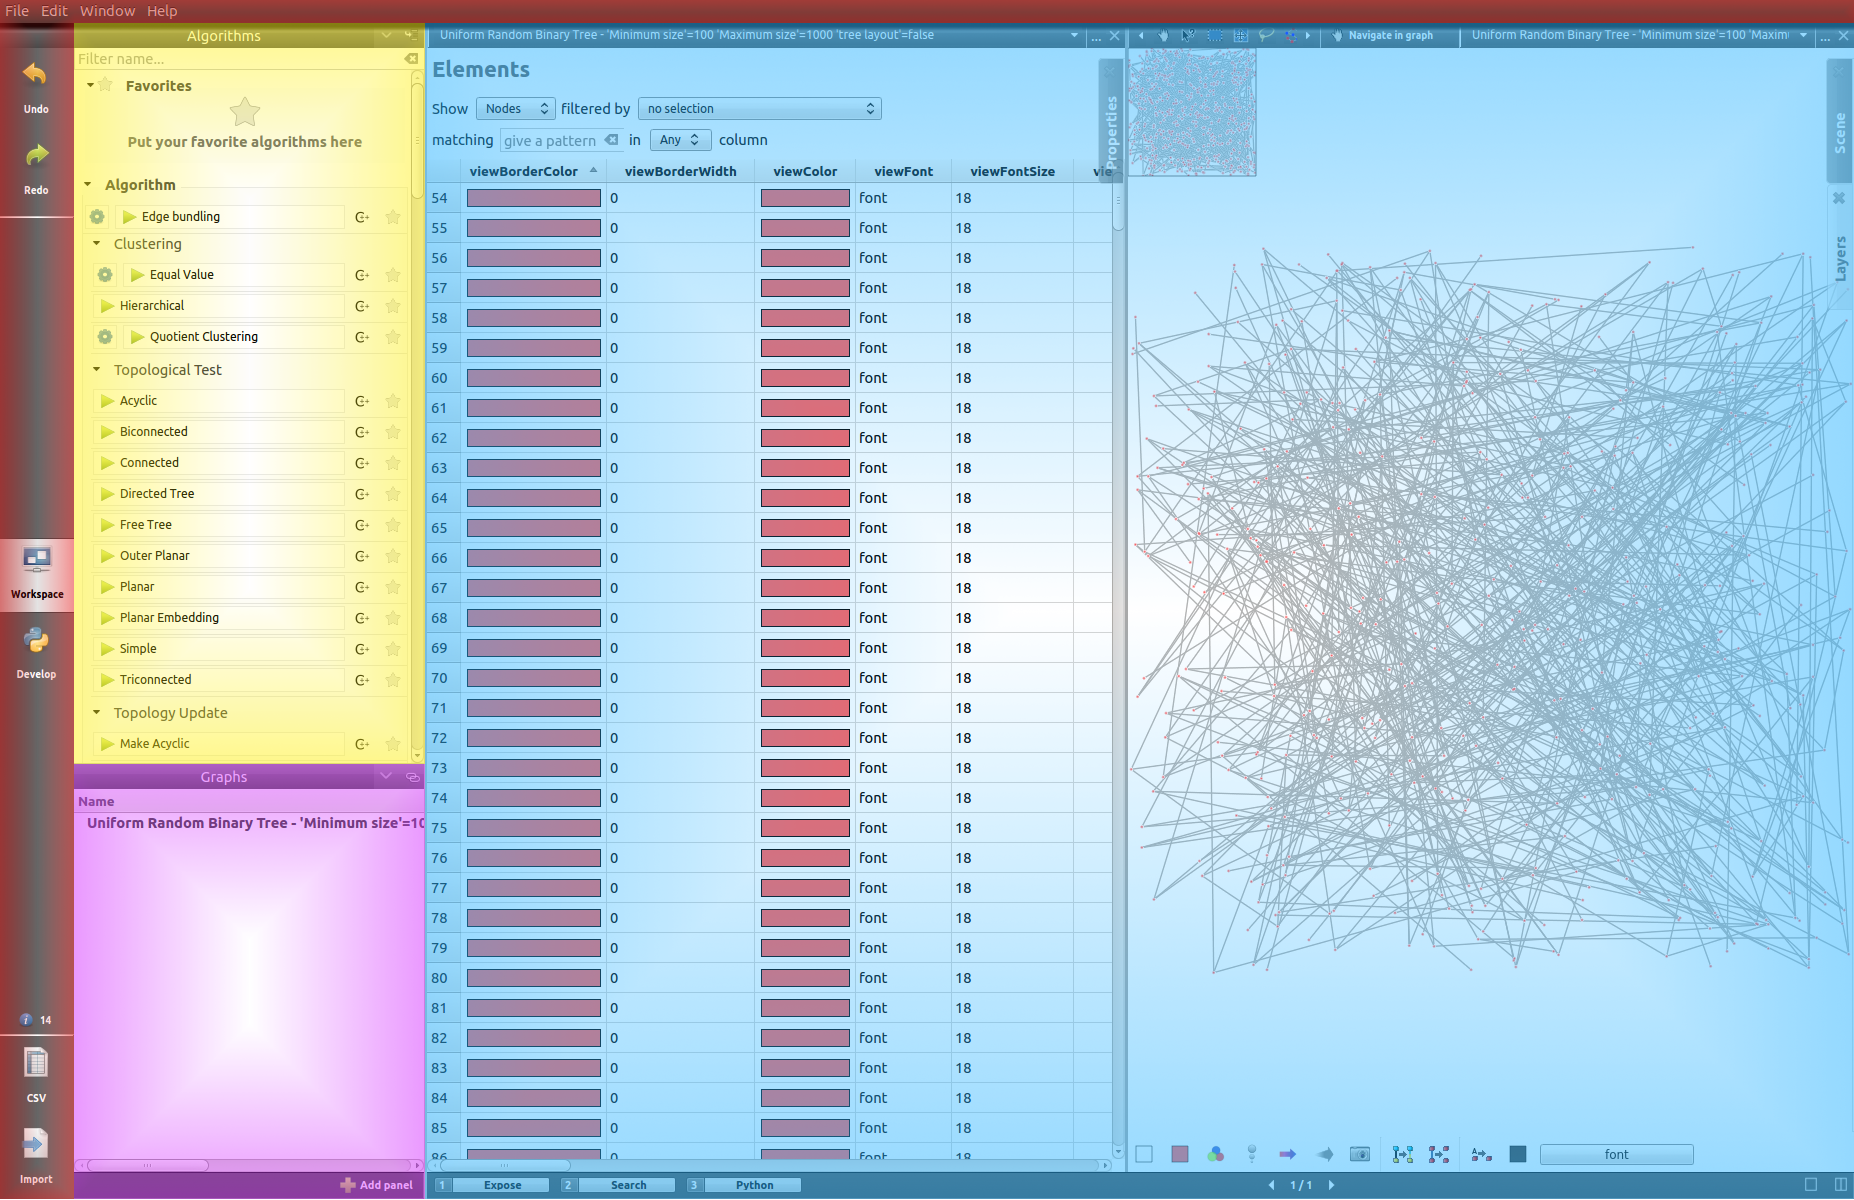
 Menus and toolbar
 Algorithm panel
 Graph list
 Workspace view
From this point and even if it is partially incorrect, we will refer to the Tulip perspective by simply using the term Tulip. Differenciating one from the other should not be too complex as the perspective window proposes the visualization actions and the Tulip framework window only offers you to manage your plugins and to choose your project.
Toolbar
The vertical toolbar, on the left of the main window, contains 6 buttons:
 Undo and
  Redo: allows the user to navigate through the operations performed on the graph.
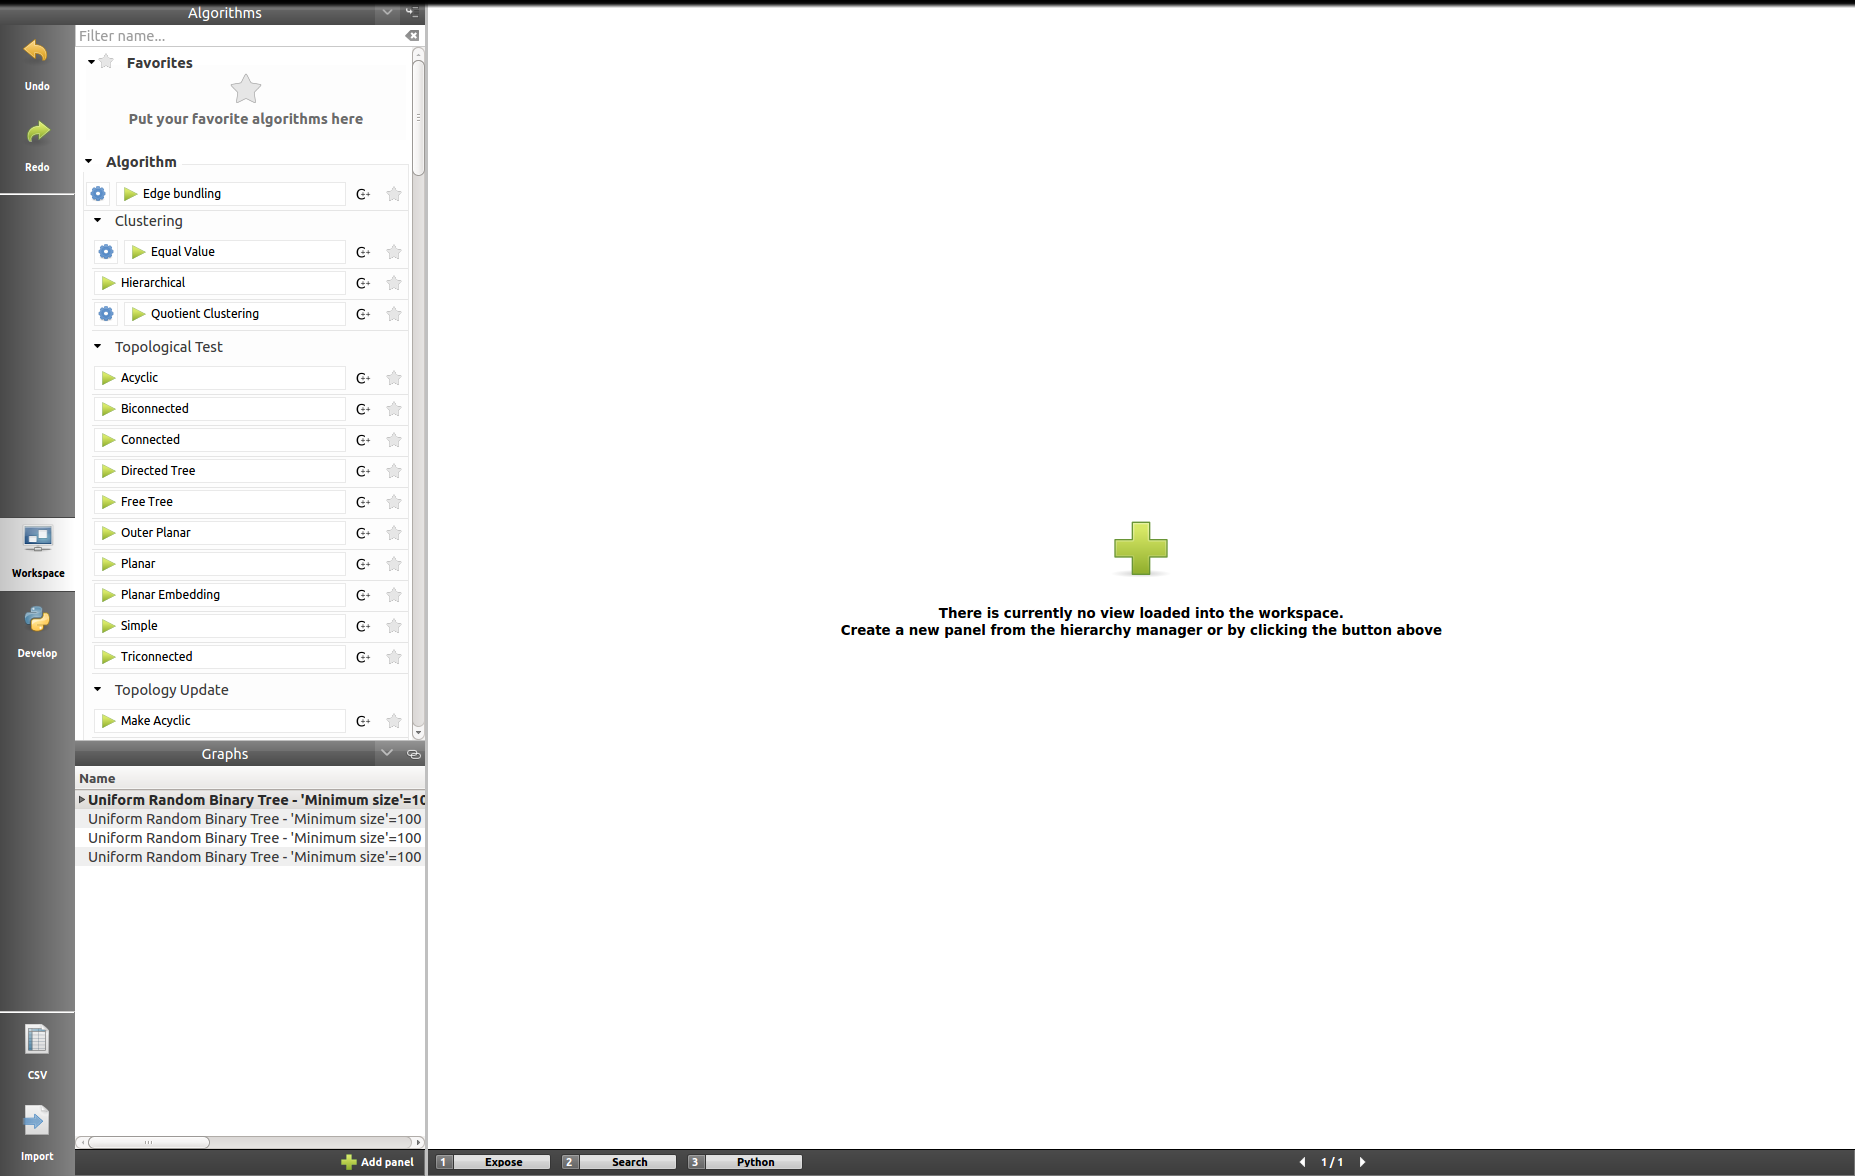
 Workspace: displays the workspace view (more information in Workspace view).
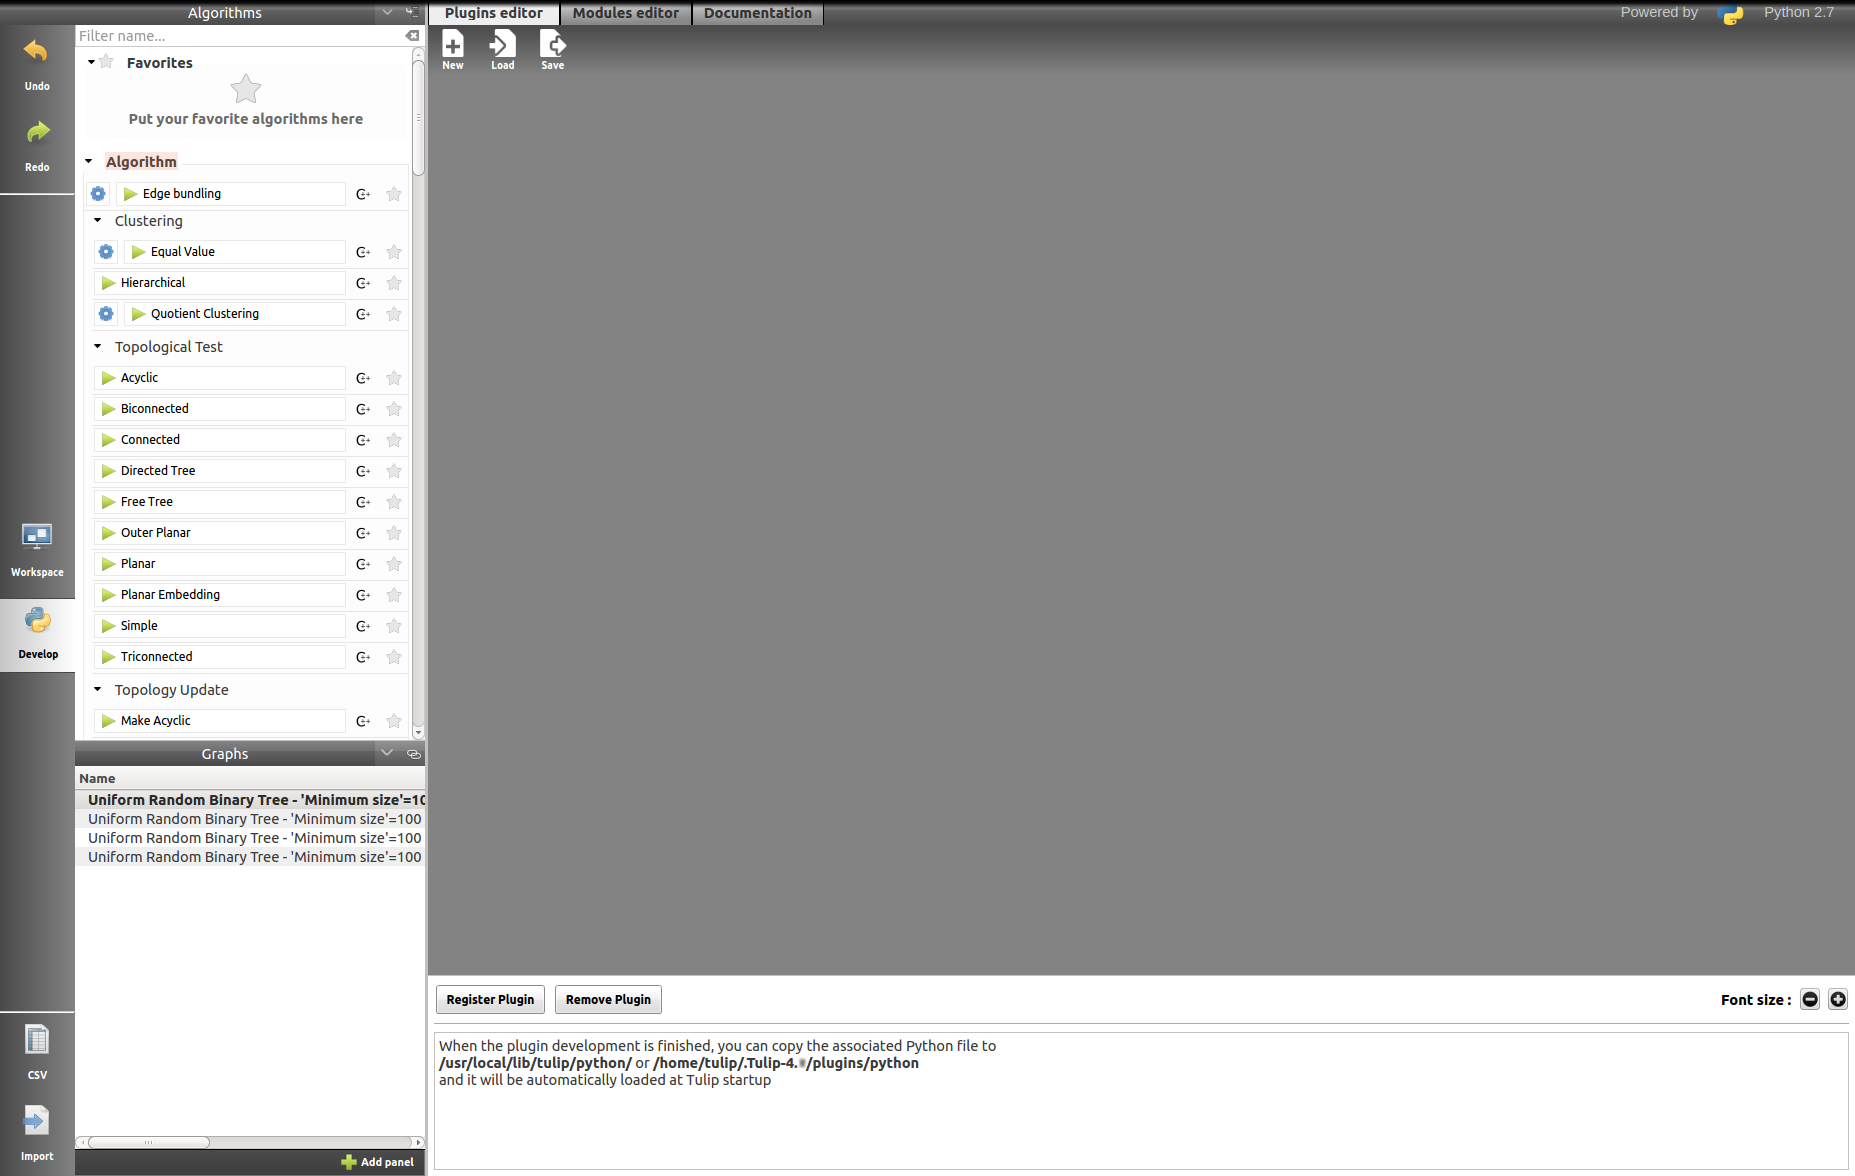
 Develop: displays the Tulip plugins editor (find more in Python plugin editor).
 CSV: open the CSV data importing wizard (more information in CSV Import).
 Import: open the graph importing wizard (learn more about it in Build a Graph).
 Plugins: only available on Mac and Windows OS, open the plugins center (see in Plugins Management (Mac OS and Windows only) for more information).
Algorithm list
Tulip proposes several ready-to-use algorithms, offering - among others - coloration, labeling and presentation solutions.
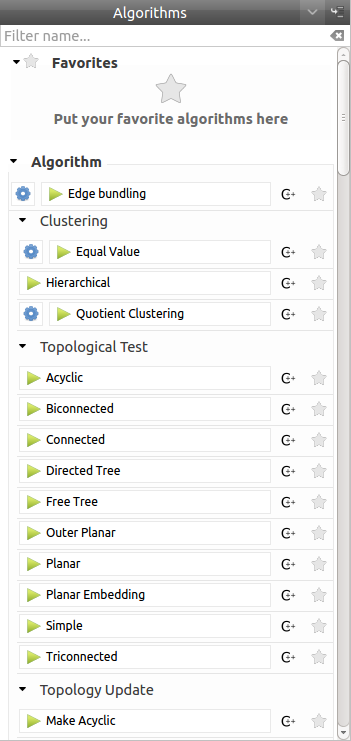
- Filter: A search field to find the algorithms whose name or (sub) group match a given pattern.
 : keep the most useful algorithms nearby by putting them in your favorites (drag them in the favorite zone or click on
  ).
). : most algorithms need parameters, you can display them by clicking on the gear icon.
 : once parameters are set, just click on the algorithm name or drag and drop it on the selected graph.
Graph list
This window gives information about the currently opened graphs.
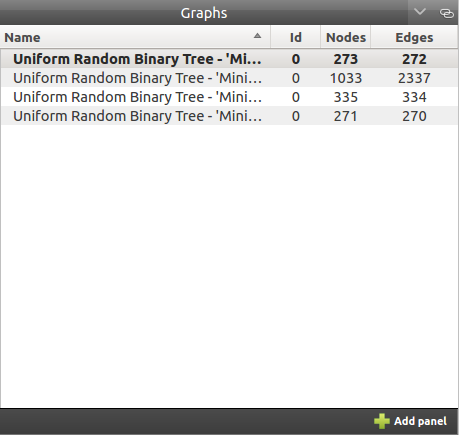
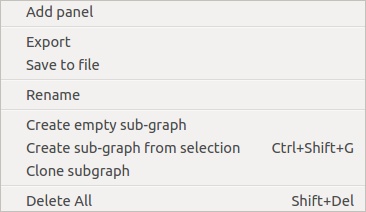
Users can right-click on the desired graph to open a menu proposing new options such as renaming the graph, deleting it, saving or exporting it (more in Save your Work).
Workspace view
The workspace is where the visualization takes place. In this space, the user can create different panels to represent data and information.

To create a new panel at least one graph must exist. Then click on the icon ![]() at the bottom-right of the graph list or right-click on its name and select Add panel (both of them mentioned in Graph list). Otherwise, when no panel is open, you can click on the icon
at the bottom-right of the graph list or right-click on its name and select Add panel (both of them mentioned in Graph list). Otherwise, when no panel is open, you can click on the icon  in the middle of the workspace. Each of those steps open the following window :
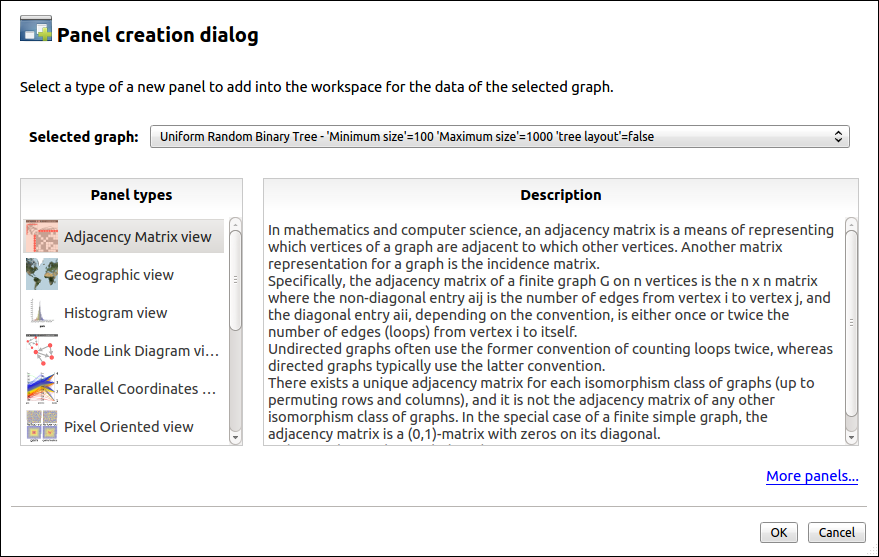
About ten panel types are available in Tulip, each of those is presented in this documentation. More information on the workspace can be found in the appropriate section.
Python plugin editor
Even with more than a hundred algorithms at your disposition, you may have special needs and/or want to implement your own solutions. The Python plugin editor allows you to create your own plugins and modules in Python.

Though the component is not entirely identical to the Python script view, they both are quite similar. Thus, you may find more information in the section presenting it.
Preferences
Tulip can be configured in several ways. The quickest way is to access to the settings window through the Edit menu, and the Preferences element.
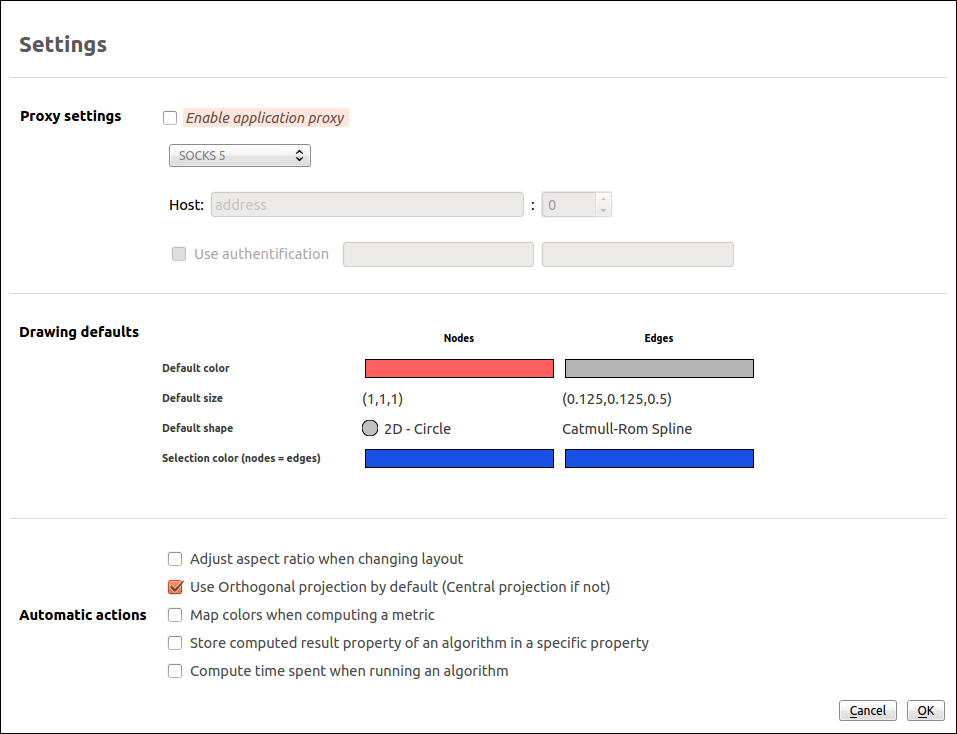
You can here change the proxy settings (soon available) such as: the socket, the host address and the port to use.
The drawing defaults, such as the color, shape and size, are used for to every new nodes and edges, however, the selection colour is only used in the node-link diagram based views.
The third part of settings, concerning the automatic actions, contains a few specific options. You can, for instance, adjust the aspect when updating the layout, indicate the default projection type, automatically adapt the colour according the metric being computed or display the time used to run an algorithm.
