
This toolbar allows to select the mouse operation you want to perform. Operations are listed and explained, from left to right of the toolbar :

3D Navigation: This tool enables the 3D navigation in a graph using the mouse movements (left button pressed); the available operations are: translate, rotate, zoom, zoom and pan. Translation is the default operation and can also be activated using the Arrow keys; rotation is activated using Shift key, zoom is activated using Ctrl key (Alt key on Mac), zoom and pan is activated using the wheel of the mouse (APPLE key on Mac). Warning, the last operation is 'mouse position centered'; i.e it attempts to translate the last 2D or 3D position of the mouse to the center of the view.
Get Information: when this operation is selected, if you click on an element of a graph (node or edge), Tulip displays all available properties of that node/edge using theElementtab of theInfo Editorsub-window (see Section 3, “Graph Editor”).
Rectangle Selection: Allows multiple elements selection. Elements within the selection box are selected. If Shift key is pressed, the newly selected elements are added to the current selection, if Ctrl key (Alt key on Mac) is pressed, the selected elements are removed from the current selection; else they replace the current selection.
Selection edition: This tool allows to modify the current selection. Available operations are horizontal stretch, vertical stretch, all axis stretch, coordinate axis rotation and translation. If no key is pressed, coordinates are modified. If Shift key is pressed, only coordinates are modified. If Ctrl is pressed, only size is modified. A left button click outside the selection box reset the selection. Press on this 'circle' to rotate the selection.
 Press on this 'triangle' to change width or height of the selection.
 The 'square' is used both for resizing AND rotating the selection.
 These five icons are used to align selected nodes.
- First one : align vertically on center
- 2nd : align horizontally on center
- 3rd : align vertically on the right side
- 4th : align vertically on the left side
- 5th : align horizontally on the bottom side
- 6th : align horizontally on the top side

Magic Selection: It enables to select all the graph connected nodes having the same metric. It works like the magic selection in image editing software. The difference is the topology of the graph.
Zoom Box: It enables to zoom on a defined rectangle area. The first corner of the rectangle is defined when pressing the mouse left button, the opposite corner is defined when moving the mouse and the zoom operation is performed on the desired rectangle when the button is released.
Delete element: allows to delete a node or edge by a single left click. The deleted node or edge is the one under the mouse when you click.
Add node: when it is selected, you can add a node in the graph by a simple left mouse click on the current graph view. The node is placed at the coordinates corresponding to the mouse position when you clicked.
Add edge: when it is selected, you can add an edge in the graph by mouse left clicking first on the source node then any left click will add a bend to the edge until a left click on the target node.
Edit edge bends: when it is selected, you can edit the bends of an edge by first selecting the edge using the mouse left button. Then a mouse left click with the Shift key pressed will add a new bend, moving the mouse with the left button pressed will allow to move an existing one, a mouse left click on a bend with the Ctrl key pressed (Alt key on Mac) will remove it.
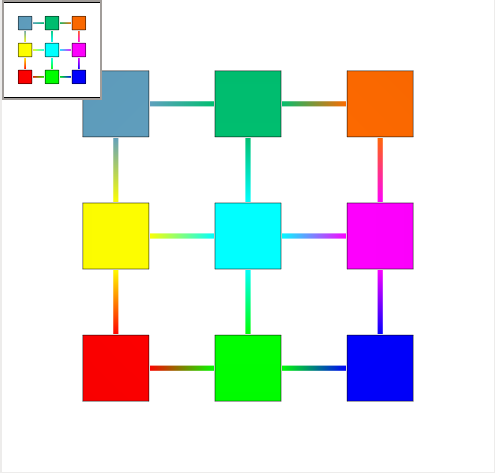
The 3D graph view subwindow is the window where the graph is displayed. It can display graph in two or three dimensions and enables to apply the mouse operations selected in the tool bar by directly clicking on the drawing of the graph. If the user lets the mouse during few seconds on a node/edge, a tooltip window displays its id and label (use “Options” menu to enable tooltips).
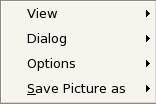
This pop-up menu is displayed when pressing on the mouse right button (press Ctrl key when mouse pressing on Mac) :
View -> Redraw view: redraw the view,View -> Center view: center the current graph in the view,Dialog -> 3D Overview: display/hide top left overview,Options -> Tooltips: enables the display of tooltips on nodes or edges,Options -> Grid: shows the grid configuration dialog.Options -> Z Ordering: Use this option when you have graph with transparent nodes/edges.Options -> Antialiasing: enable/disable antialiasing.Options -> Textured meta node: enable/disable meta node texture rendering.Save picture as -> ...: to save the graph picture in multiple format.
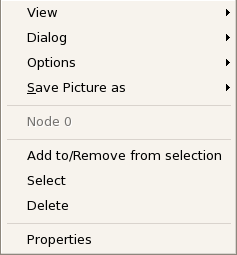
If you press the mouse right button (press Ctrl key when mouse pressing on Mac) when on a graph element, you have this contextual menu to perform simple actions on this element :
Add to/Remove from selection: this allows to change the selection state of the element,Select: the current element replaces the whole selection,Delete: this permanently removes the element from the current graph,Go inside: if the element is a metanode, this shows the corresponding subgraph in the current view,Ungroup: if the element is a metanode, this permanently removes it and its corresponding subgraph,Properties: this shows the element properties in the “Element” tab.
All actions in this dialog are just performed for the current view window.
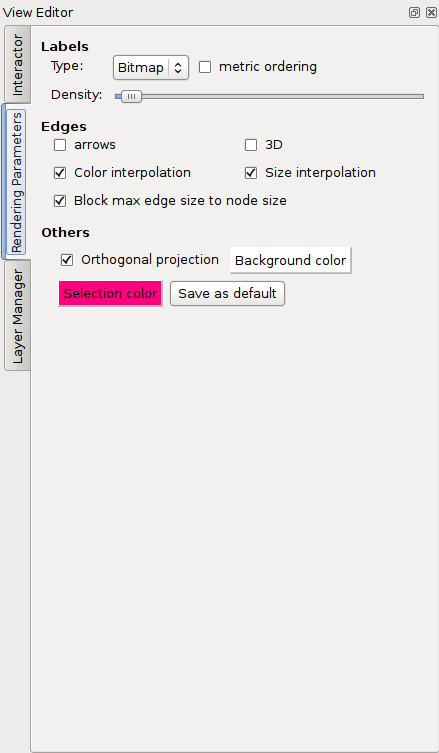
This dialog is displayed when clicking on the Configuration tab at button left corner. Enables to configure the rendering of the graph. The available options are grouped in the following three frames:
Labels: the options in this frame only affect the display of the labels:Type: this indicates the text display mode which can be one of Bitmap, Texture or 3D.metric ordering: when checked the labels are displayed in using the viewMetric property decreasing order.Density: use this slider to avoid having too much labels displayed (max is on the left).
Edges: this frame options affect the way the edges are displayed:arrows: enables/disables the display of arrows.3D: enables/disables the display of edges in 3D.Color interpolation: when checked the edge color is interpolated from the color of its source node to the color of its target node.Size interpolation: when checked the edge size is interpolated from the size of its source node to the size of its target node.Block max edge size to node size: when checked the edge size can not be greater than the node size.
Others: the options in this frame are related to general aspects of the rendering:Orthogonal projection: enables/disables the orthogonal projection. If not checked, the perpsective projection is used.Background color: enables to choose a color for the background of a graph view.Selection color: enables to choose a color for the selected nodes/edges. If you click on \"Save at default\", this selection color is apply when you open a new view.
All actions in this dialog are just performed for the current view window.
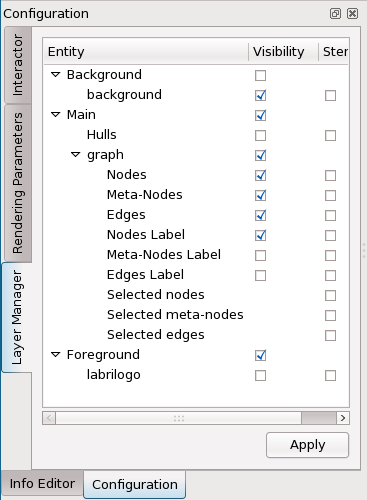
This dialog is displayed when clicking on the Configuration tab at button left corner. Enables to configure the elements visibility and priority. The available options are grouped in two columns :
Visible: Visibility of the entityStencil: Priority to display the entity
In this menu, you see Hull entity, it represents the convex hulls of the graph. When you click on visible, a hierarchy of convex hulls is build. The name of a hull is the name of the corresponding subgraph.
In a future version you could add/modify/remove entity
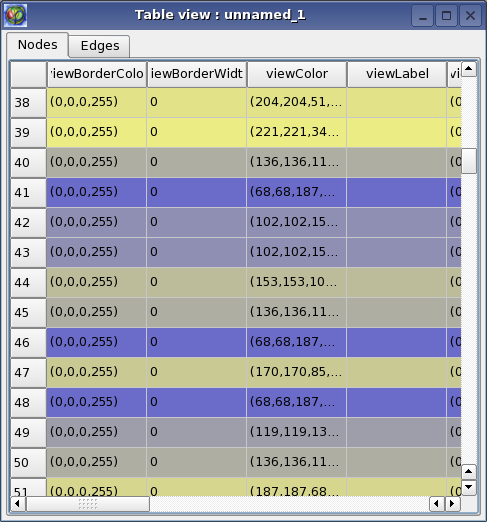
In this view you can visualize the values of the properties of the graph elements (nodes or edges) in a table form, displaying one element's properties values by row.
You have two tabs : Node and Edge.
Color of a cell depends on the value of the viewColor property of the node/edge and the color of the text depends on the value of the viewLabelColor property of the node./edge